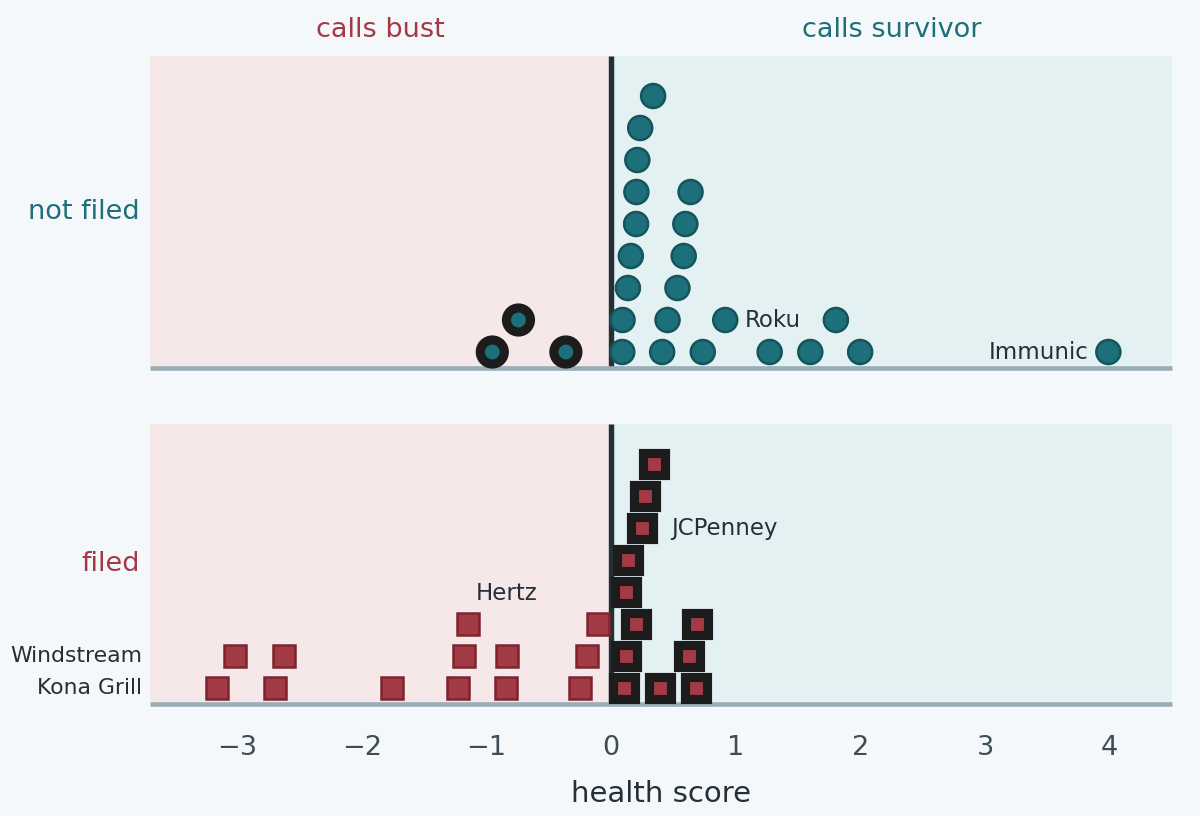
The picture at the top is a bankruptcy model. Fifty companies, squashed onto one score, cut at zero. Circles are firms that had not filed. Squares had. They sit on a floor and stack where the scores agree, the way a histogram does. Height is how many firms landed there, and that is all it is. Pink side, the model calls bust. Blue side, it calls survivor. A dark ring means the call is wrong.
That is the whole machine. Everything else on this page is what the line actually is, why Edward Altman reached for it in 1968, and what happens when you fit the same thing to a scruffy modern sample. I like this example because you can see every weight. Most machine learning demos never give you that.
It's the opening machine learning example in Value Investing with Machine Learning (the yellow one). The notebook is there if you want the Python. You don't need it to follow this.
What Altman did
In 1968 Altman published "Financial Ratios, Discriminant Analysis and the Prediction of Corporate Bankruptcy" in the Journal of Finance. He was interested in a practical complaint about ratio analysis. Analysts looked at one ratio at a time, and the ratios argue with each other. A firm can be profitable and drowning, or liquid and loss-making. Which number wins?
Beaver, a couple of years earlier, had already shown that single ratios could separate failing firms from healthy ones for several years before the event. Cash flow against total debt was his best. He was wary of throwing a pile of ratios into one statistical pot. Altman did it anyway. If several ratios matter, something has to decide the weights, and he didn't want the something to be a rule of thumb.
His sample was small and careful, which is why it worked as well as it did. Thirty-three manufacturers that filed under Chapter X of the old Bankruptcy Act, between 1946 and 1965. Thirty-three that didn't, matched roughly on industry and size, assets between $1 million and $25 million. The surviving group's average assets were about $9.6 million. Ratios came from the last annual statement before the filing, on average seven or eight months before. Manufacturing only. No banks, no tiny firms, no giants.
He started from 22 candidate ratios and kept five.
X1 is working capital over total assets. Working capital is current assets minus current liabilities. Cash and things that will become cash soon, against bills due soon, scaled by the size of the firm.
X2 is retained earnings over total assets. How much of the balance sheet has been earned and kept, rather than raised last Tuesday. Young firms and firms that have spent years losing money score badly. That is the point of it.
X3 is earnings before interest and tax, over total assets. Profit the assets are producing, before the capital structure gets a vote. A firm doesn't look unprofitable here just because it borrowed.
X4 is the market value of the equity over the book value of total liabilities. What the stock is worth, against what the firm owes. Book equity can be an accounting fiction. The share price is a second opinion. When the equity is large relative to the debt, the debt is a smaller problem, at least on the day you measure it.
X5 is sales over total assets. How hard the assets are being worked. On its own this one barely differed between his two groups. He kept it because inside the combination it still helped a bit.
The fitted line, in the version you can type with ordinary decimals, is:
Every weight is positive. More working capital, more retained earnings, more profit, a more valuable equity, more sales, a higher Z, and higher means safer. In the paper the first four ratios were written as percentages, so those four weights were a hundred times smaller (0.012, 0.014, 0.033, 0.006) and the sales weight stayed near 0.999. Same score, different clothes.
The two groups did not sit anywhere near each other. A year before failure, the averages looked like this.
| Ratio | Failed | Survived | F |
|---|---|---|---|
| Working capital / assets | −6% | 41% | 32.5 |
| Retained earnings / assets | −63% | 36% | 58.9 |
| EBIT / assets | −32% | 15% | 26.6 |
| Market equity / liabilities | 40% | 248% | 33.3 |
| Sales / assets | 1.5× | 1.9× | 2.8 |
Group means from Altman (1968), 33 firms a side. The F statistic is his test of whether the two averages differ. Sales doesn't, really. Retained earnings is the loud one.
There is a lot of daylight in that table. You could guess a fair number of the failures by eye, which he says himself. The average Z for the survivors was about 5. The failures sat around zero, slightly negative. He put the cut that mis-filed the fewest of these particular firms at 2.675. Below 1.81 he treated as clearly distressed, above 2.99 as clearly fine, and the band in the middle as a zone where the piles overlap. "Above 3 safe, below 2 risky" is people remembering that band.
On the 66 firms the weights were estimated from, the score got 63 right. Thirty-one of the 33 failures, 32 of the 33 survivors. Two years before the filing it still caught about 72 percent of the firms that eventually failed. On a fresh set of 25 bankrupt manufacturers, 24 fell below the cut.
He was careful about the 95 percent, and the care is the part worth copying. Those 66 firms are the ones the weights were built to separate. Of course it looks good on them. He had also searched through 22 ratios to find 5, so some of the fit is luck in the search. The fresh 25 are the number with more claim on you. Even those are an easier question than the one a lender actually has. "Does a firm we already know is dying get a bad score" is not the same question as "of all the firms with a bad score, how many die."
He checked the second question a bit, on 66 manufacturers that had reported losses and mostly did not go on to fail. The model called 14 of them bankrupt. Fifty-two right, on a pile of firms that were already obviously sick. Decent. And he noticed that a lot of the mistakes lived in the grey band between 1.81 and 2.67, which is why the band exists.
What the line actually is
Linear discriminant analysis is a way of drawing that cut when you have more than one measurement.
Each firm is a point. Two ratios, and you can plot the point. Five ratios, and the point lives in a space you can't look at. The geometry is the same either way. You have two clouds. You want one direction through the space. Along that direction the clouds should be as far apart as possible, judged against how spread out each cloud is. Drop every firm onto that direction and each firm becomes a single number. That number is Z. Put a cut on the number line. One side is bust, the other side isn't.
"As far apart as possible, relative to the spread" is doing the real work. A ratio where the two averages sit on top of each other gets almost no weight. A ratio that differs only because one weird firm is enormous also gets down-weighted, because the within-group spread is huge, and a direction that depends on one firm is a bad direction. A ratio where the groups differ and the firms inside a group agree with each other gets a big weight.
There is a second way to say the same thing, and it is where the assumptions sneak in. Suppose each cloud is a bell shape, and the two bells are the same shape and the same size. Then the boundary that best separates them is flat, and the formula for it is this line. The score becomes a comparison of how much more likely one group is than the other. With equal-sized groups, the natural cut is where the two are tied. Above the cut, one group. Below, the other.
Accounting ratios are not bell-shaped. Returns and retained earnings are skewed, and a few firms sit miles from everyone else. The two clouds are not the same size either. Firms near failure fan out. Healthy firms in a matched industrial sample cluster. When the clouds have different shapes, the best boundary bends. That version has the even worse name quadratic discriminant analysis. Altman used the straight one.
The labels also have to be known, and two-valued. "Filed" is a legal event. "A bit poorly" is not a group. And both his sample and the one below are half failures, by construction. Real filings are rare. A line trained on a 50/50 pile will be far too keen if you point it at every listed company and read the result as a probability. The score can still rank firms. It is not "a 30 percent chance of a filing" unless you put the real base rate back in, which this model never does. Altman's Z is a score. People who treat 1.8 as a probability have added a step he didn't take.
Why this, in 1968
He says it fairly directly. The thing he wanted to predict is a class, bankrupt or not. Discriminant analysis was the standard tool for sorting an observation into one of several groups you had already defined, using several measurements at once. R. A. Fisher had set it out in 1936, originally to tell species of iris apart from petal lengths. Same maths. Grimmer subject.
A regression of a 0/1 label on the ratios was around, and people did it, but it doesn't know the answer is supposed to be a class. It can tell you 1.4 or −0.2. Logistic regression, which does give you a probability and doesn't need the bell curves, was not something a finance PhD fitted on a desk in 1968. Ohlson did the logit version in 1980, in large part to get away from those assumptions and to talk in probabilities. With 33 firms a side and a gap as wide as the table above, logit and the straight line land in nearly the same place. The separation is so large that the argument about the exact shape of the boundary is a second-order complaint. The retained-earnings gap is what made the model work.
The other reason is the one I care about. He needed a formula a credit analyst could compute. One weighted sum, published, with zones written next to it. Discriminant analysis reduces any number of ratios to a single score (one less dimension than you have groups, and he had two groups, so one dimension). That was the product. ZETA, the model he built with Haldeman and Narayanan in 1977, is still a discriminant score, just a later one with a different variable list. The straight line was not a temporary stand-in for a neural net. It was the thing he was trying to build.
The same trick, on worse data
In the book I refit this with a few lines of scikit-learn, on purpose with data a careful paper would throw out. Twenty-five firms that went bankrupt, taken off the Wikipedia list around May 2021. Hertz, JCPenney, Sears, Chesapeake, Peabody, iHeartMedia, Dean Foods, Valaris, Windstream, that whole recent crowd. Twenty-five that were not on the list. The survivors are just a grab of listings from the few years before, so the "healthy" pile contains Roku, Atlassian and Take-Two, and also a clutch of biotechs, Gildan, Sprouts, and whatever else fell out of the spreadsheet.
No matching on industry or size. Four ratios rather than five. These are the four in Altman's later Z'' score, the one he used so the model could leave manufacturing and didn't need a share price. Sales over assets is gone, because a retailer and a software firm turn their assets over at completely different rates, and the ratio was mostly measuring the industry. The equity ratio is book equity over liabilities, not the market value, so you can compute it with no quote.
The file is a bit dirty, and I have left the dirt in.
David's Tea is in the survivor pile. It sought creditor protection in Canada in July 2020, and that proceeding was recognised under Chapter 15 in the US. The label in the spreadsheet is wrong, or at least arguable, and the line happens to call it a survivor. TPVY is not even the shares of an operating company. It is a listed note of TriplePoint Venture Growth. The ratios you get if you ask a data vendor for that ticker are not a manufacturer's ratios. Two of the "survivors" are banks, Banco Macro and NatWest, and working capital in a bank is a different sentence from working capital in a factory. Altman stayed out of banks for that reason. I'm keeping every row, because this is a lesson about a line, and the mess is part of what the line is being asked to swallow.
Here are the two ratios that actually differ, working capital and book equity. Hover a dot. On a phone, tap it.
survivor pile filed ringed, the line gets it wrong
The dot tagged 10.5 is Immunic, pinned to the top of the chart. Book equity there is about ten times liabilities, because there are almost no liabilities. A black outline means the line disagrees with the label. The accounts are the ones in the book, generally the year of the filing or the year before.
You can see the problem before any fitting. Failures tend to sit left, short of working capital, and down, thin on book equity. Windstream, Kona Grill and iHeart are not subtle. JCPenney, Fred's, hhgregg and Valaris are sitting in the same neighbourhood as firms that did not file. And the survivor cloud goes all over the place, because "not on a Wikipedia list" is a weak definition of healthy.
The line those 50 produce
Fit the same model. Point the score so a bigger number means closer to the survivor cloud. With 25 firms a side, the natural cut is zero.
These are the weights printed in the book, to two decimals. The charts use the unrounded fit. The sign depends on which class you code as 1. I have pointed it so a bigger H is safer. Three of the four weights agree with Altman. More working capital, more earnings, more book equity, a safer score. Retained earnings comes out with the wrong sign. Holding the other three still, more retained earnings makes the model more suspicious. That is embarrassing, and it is what this sample actually produces. More on that in a minute.
The raw weights are not comparable to each other. EBIT over assets only moves by tenths. Book equity over liabilities moves by whole numbers. A weight of 3.17 against a weight of 0.25 does not mean earnings matter twelve times as much. Scale them by how much each ratio typically varies and the picture is calmer. A one-standard-deviation move in working capital shifts H by about 0.9. The same size move in earnings shifts it by about 0.8. Book equity, about 0.4. Retained earnings, about 0.4 the wrong way. Working capital and earnings are the levers. Book equity looks huge if you stare at the averages, and then one biotech blows the spread up, so the fitted weight stays shy. That down-weighting is the method working as designed.
Same picture as the one at the top. The piles are counts. Hover for the firm. The diamond is whatever the sliders below are set to.
On these 50 firms, with the labels as recorded, the line gets 35 right. It catches 13 of the 25 that filed, and it only raises a false alarm on 3 of the 25 in the survivor pile. It misses 12. Leaving each firm out and refitting on the other 49 does not move a single firm across the cut. So this is not the line memorising one strange row. The overlap is really there. Seventy percent, on a sample built to be half and half and then scored on those same firms, is a modest result. Altman got 95 percent in-sample because his groups were far apart. These aren't.
The three false alarms are Banco Macro, NatWest and Ironwood. Two of those are the banks. Ironwood is a drug company whose retained earnings were about −4.8 times assets. It was still being financed. The line sees a hole where a factory would have already died, and calls it a bankruptcy. Fair reading of a factory. Ordinary Tuesday for a clinical-stage biotech.
The misses are the interesting ones, because they are the bankruptcies a ratio model misses. JCPenney, Tailored Brands, Bon-Ton, hhgregg, Fred's. Retailers whose accounts were mediocre rather than wrecked. Valaris, an offshore driller, had more book equity than liabilities and a small loss, and then 2020 happened to the oil market. A ratio does not see the oil price. Intelsat was earning money with negative book equity. Briggs & Stratton had positive retained earnings. The line files all of them with the survivors.
The ones it catches easily are the ones you would catch by eye. Hertz, working capital about −34 percent of assets, score about −0.84. Sears, Peabody, McClatchy, Akorn. Cobalt, losing money at a rate of about one times assets. Kona Grill, Windstream and iHeart, which are not subtle. Windstream's working capital is about −1.7 times assets. There is no model in that. There is a balance sheet that has already fallen over.
Immunic gets the healthiest score in the sample, about +4, miles clear of everyone else. Lots of current assets, book equity more than ten times liabilities, and retained earnings around −3.8 times assets. It was losing money in trials. The line looks at the cash and the absence of debt and says this firm is not about to miss a coupon. That is a statement about solvency, and it is roughly right. It is not a statement that Immunic was a good business. A bankruptcy model that can't tell "funded by equity, sitting on cash" from Gildan is working as designed. The design is narrow.
A comparison I keep coming back to. Ignore three of the four ratios. Call the firm bust if working capital is worse than about −5 percent of assets, with that cut chosen to flatter these same 50 firms. That one-number rule gets 33 right. Two false alarms, 15 missed filings. The four-ratio line gets 35. Three more filings caught, one more false alarm. That is the whole gain. On Altman's data the combination was the point, because several ratios separated at once and they disagreed with each other. On this data the groups mostly separate, weakly, on working capital, and the other three ratios are along for the ride.
Feed it a firm
The sliders are the four ratios. The score is the same line. The diamond on both charts is you. Costco is the set of rough figures from the book, and it lands where the chapter said it would.
Try "Costco, but Hertz's working capital". One ratio, and the score gives up and crosses zero. That is the 2.19 weight, felt by hand. Then try Altman's average failed manufacturer and his average survivor. I have plugged his equity ratio in even though his is a market value and ours is book, so don't treat the number as a Z-score. The point of the preset is the gap. His average failure still lands on the bust side of this wobbly modern line, and his average survivor lands a long way onto the safe side. The 1968 clouds were far enough apart to survive a slightly different fourth ratio.
Why these weights are not his
Put the samples next to each other and the rhyme falls apart. Altman's columns are from the 1968 paper. The other two are this file, means, not medians.
| Ratio | Altman, 1968 | This file | ||
|---|---|---|---|---|
| Failed | Survived | Filed | Survived | |
| Working capital / assets | −6% | 41% | −14% | 22% |
| Retained earnings / assets | −63% | 36% | −50% | −50% |
| EBIT / assets | −32% | 15% | −17% | −12% |
| Equity / liabilities | 40% | 248% | 6% | 109% |
His equity ratio is the market value of the shares over liabilities. The two columns for this file are book equity.
His failed firms had negative working capital and his healthy manufacturers had working capital equal to about 40 percent of assets. Ours differ too, −14 percent against +22 percent, a real gap, a smaller one. Earnings in his sample were −32 percent of assets against +15 percent. In this file the averages are −17 percent and −12 percent. The "healthy" average is a loss.
Retained earnings is the tell. Both of our groups average about −50 percent of assets. The same number. His were −63 percent against +36 percent, which is why that ratio dominated his F statistics and why his weight on it is positive and large. In the modern grab-bag, half the survivor pile has never retained anything. They are young, or they are biotechs, or they bought growth. The average is being yanked down by Ironwood, Immunic, Halozyme, Zogenix. The median survivor is only about −4%. The median failure is about −24%. There is a median gap. The model does not fit the median. It fits the cloud, and the survivor cloud is a mess, so the mean gap is zero and the fitted weight has nothing honest to hold onto.
It then gets worse, because retained earnings and EBIT move together here. The correlation is about 0.7. Once earnings are in the score, retained earnings has little left to say, and the leftover comes out with the wrong sign. The weight is not "the effect of retained earnings". It is whatever is left after the other three ratios have had their say, estimated from 50 rows. With a correlation like that and a couple of extreme firms, the leftover is noise. I would not interpret that −0.37 as a fact about bankruptcy. I would interpret it as the sample being too small and too strange for a partial effect.
Book equity looks separated if you stare at the mean, about 1.09 against 0.06. Immunic's 10.5 is sitting inside the survivor mean. The medians are about 0.43 and -0.01. Still a gap. Smaller than the mean suggests. And the one insane point inflates the scatter, which is exactly the situation where discriminant analysis turns the weight down. A direction that is really "Immunic versus everyone" is not a direction you want to bet on.
Altman kept refitting for the same underlying reason. The world the weights were estimated in went away. He has a Z' that swaps market equity for book equity, for private firms. Z'' drops sales over assets, for firms that aren't manufacturers, and the zones people quote for that one are above 2.6 and below 1.1. A 1995 version for emerging-market bonds uses those same four ratios and adds a constant, 3.25, so the number lines up with US bond-rating bands. He wrote in the original paper that a 20-year window was already a compromise because average ratios drift. Later he noted that by the late 1990s a much larger share of ordinary industrial firms had a Z under 1.81, and that a lot of the rise in average Z was the stock market inflating the equity ratio. A formula is a picture of its sample. His sample was postwar American manufacturers of a modest size. This one is a Wikipedia page and a spreadsheet, with a bond ticker in it.
If you score these 50 with his Z'' weights and don't refit anything, you get a ranking in the same neighbourhood. His published cutoffs do not travel. The average survivor in this file would not clear a "safe" line built for profitable manufacturers, because the average survivor here is not one. Refitting the weights bought two firms over a single ratio. It did not uncover a signal that wasn't already in the accounts.
So is it the right tool?
For the lesson, yes. You can write every weight on a card. You can see the cut. You can argue with a particular firm, and several of the particular firms are funny. The moment the model is a forest of trees, the mistake stops being inspectable, and with 50 rows you were not entitled to the extra machinery. If the only thing you take from machine learning is "a weighted sum, fitted so two groups land on opposite sides of a cut, and no better than the data you handed it", you have the part that still matters when the models get fancy.
For the job Altman actually had, yes, with the warnings he printed. He wanted weights on several ratios at once, the output had to be a formula, and discriminant analysis was the classification method a statistician in 1968 would fit. Beaver had done the one-ratio version and doubted the multivariate one. A discussant told him to try it. Altman tried it. The groups were far apart, so the bell-curve assumption and the equal-scatter assumption were not what carried the result. The fresh 25 bankruptcies are the evidence that those ratios really did look different a year before a manufacturing failure, in that era, in that size range. Ninety-six percent on a fresh set of failures is a real finding. It is a finding about manufacturers that failed between the war and the Great Society, measured the year before they filed.
For deciding whether a given company will file next year, it is a blunt instrument, and this rerun is the demonstration rather than a rhetorical one.
The sample is balanced and tiny. Fifty firms, chosen because the label was already known. Real filings are a small fraction of listed companies. A 70 percent hit rate on a 50/50 quiz does not survive contact with the market. Point a cut tuned on equal group sizes at a world where 2 percent of firms file, and you will accuse a lot of living firms. Altman watched this happen to his own score. The Type II errors, calling a firm distressed when it does not fail, grew. By the late sample a large minority of ordinary firms had a Z that his original cut would have called dangerous. He ended up recommending the bottom of the grey zone, 1.81, rather than 2.675, because the old "optimal" cut was crying wolf. The score remained useful as a ranking. The zones needed updating because the world moved, and because a matched sample does not know the base rate.
The errors here have a shape, which is more informative than the 35 out of 50. The line misses ordinary bad businesses whose accounts have not fallen off a cliff, and it panics at banks and at biotechs that fund losses with equity. Those are the industries its ratios were built for, showing through. Add David's Tea, which is labelled a survivor and did in fact seek protection, and the line misses that one too. The spreadsheet's mistakes and the model's mistakes are not the same kind of mistake, and both of them are in the number.
Ratios are skewed, and one firm moves a covariance. Immunic moves this one. Capping extreme ratios, or allowing the boundary to bend, would change the weights. With 50 rows I wouldn't trust those variants either. I would want a lot more filings, an industry, and a proper held-out period. Fit on one decade, score the next. He did versions of that. This page doesn't. There isn't enough here to do it honestly.
If I were building a screen I actually meant to use, I would use logistic regression, or a penalised version of it. I would get a probability, I would not have to pretend the ratios are bell-shaped or that the two groups spread out the same way, and I would have a natural place to put the real frequency of filings back in. I would include industry, because sales over assets and working capital in a bank are traps, and this file walked into both. I would not balance the sample and then forget I had done it. I would judge the model on filings it didn't get to see, and I would look harder at the misses than at the hit rate. On this particular table of 50, logit would draw almost the same line, because the signal is weak and roughly linear and there are four columns. The upgrade matters when there are thousands of firms and the number is supposed to mean a rate.
What I would keep from him, even then, is the discipline at the start. The ratios have to mean something before the fit. Debt against earning power is a reason a firm dies. A column that happens to line up in one sample of 50 is how you reinvent the classic stupid correlation, the one where margarine consumption tracks the divorce rate. The algorithm will happily fit that. The line can only rearrange facts you were right to hand it.
The 50 firms
Sorted by the score, healthiest first. A red "wrong" is the line disagreeing with the label in the file. The label is not gospel. David's Tea is the obvious example.
Show the full table
| Firm | Label | Accounts | WC/TA | RE/TA | EBIT/TA | Equity/liab. | Score | Line |
|---|---|---|---|---|---|---|---|---|
| Immunic (IMUX) | Survivor pile | 2016-12-31 | 87.4% | −380.8% | −64.0% | 10.47 | 3.99 | survivor |
| Zogenix (ZGNX) | Survivor pile | 2017-12-31 | 67.9% | −137.0% | −22.4% | 2.60 | 2.00 | survivor |
| Halozyme (HALO) | Survivor pile | 2019-12-31 | 80.9% | −106.7% | −14.8% | 0.19 | 1.80 | survivor |
| Gildan (GIL) | Survivor pile | 2016-12-31 | 36.9% | 63.7% | 11.0% | 2.43 | 1.60 | survivor |
| IVA | Survivor pile | 2018-12-31 | 70.9% | −41.4% | −42.4% | 3.38 | 1.27 | survivor |
| Roku | Survivor pile | 2015-12-31 | 50.1% | −100.3% | −22.7% | 0.43 | 0.92 | survivor |
| Take-Two (TTWO) | Survivor pile | 2018-03-31 | 18.3% | 2.0% | 3.7% | 0.66 | 0.74 | survivor |
| Fred's (FRED) | Filed 2019 | 2019-02-28 | 24.7% | 11.9% | −1.3% | 0.68 | 0.69 | survivor, wrong |
| PHI (PHIIK) | Filed 2019 | 2017-12-31 | 19.5% | 21.6% | 2.4% | 0.78 | 0.68 | survivor, wrong |
| Atlassian (TEAM) | Survivor pile | 2015-06-30 | 12.7% | 12.6% | 3.6% | 0.92 | 0.64 | survivor |
| Bon-Ton (BONT) | Filed 2018 | 2017-01-31 | 30.6% | −7.7% | −4.1% | -0.01 | 0.62 | survivor, wrong |
| David's Tea (DTEA) * | Survivor pile | 2019-02-28 | 50.7% | −39.2% | −32.4% | 1.23 | 0.60 | survivor |
| Abercrombie & Fitch (ANF) | Survivor pile | 2017-02-28 | 28.5% | 107.8% | −0.2% | 1.19 | 0.58 | survivor |
| Quidel (QDEL) | Survivor pile | 2017-12-31 | 21.7% | −1.3% | −2.8% | 0.32 | 0.53 | survivor |
| Clean Harbors (CLH) | Survivor pile | 2016-12-31 | 16.0% | 15.6% | −0.1% | 0.42 | 0.45 | survivor |
| S&W Seed (SANW) | Survivor pile | 2015-06-30 | 11.8% | −4.1% | −3.4% | 0.74 | 0.41 | survivor |
| Cenveo (CVO) | Filed 2018 | 2016-12-31 | 7.5% | −95.1% | −2.4% | -0.39 | 0.40 | survivor, wrong |
| hhgregg (HGGG) | Filed 2017 | 2016-03-31 | 25.9% | −8.5% | −13.4% | 0.46 | 0.35 | survivor, wrong |
| TriplePoint note (TPVY) * | Survivor pile | 2017-12-31 | 0.0% | −0.0% | 2.0% | 0.85 | 0.34 | survivor |
| Valaris (VALP) | Filed 2020 | 2019-12-31 | 1.4% | 4.0% | −3.5% | 1.22 | 0.27 | survivor, wrong |
| JCPenney (JCP) | Filed 2020 | 2020-02-29 | 9.9% | −45.9% | −7.1% | 0.12 | 0.25 | survivor, wrong |
| Zendesk (ZEN) | Survivor pile | 2019-12-31 | 14.1% | −46.1% | −13.1% | 0.43 | 0.23 | survivor |
| Sprouts (SFM) | Survivor pile | 2019-12-31 | −1.1% | −3.1% | 3.0% | 0.27 | 0.21 | survivor |
| AdvanSix (ASIX) | Survivor pile | 2016-12-31 | 0.9% | −2.7% | 1.1% | 0.31 | 0.20 | survivor |
| Postal Realty Trust (PSTL) | Survivor pile | 2017-12-31 | −0.3% | −52.6% | 0.5% | -0.23 | 0.20 | survivor |
| Chesapeake (CHK) | Filed 2020 | 2019-12-31 | −7.0% | −87.8% | −3.9% | 0.37 | 0.20 | survivor, wrong |
| Tanger (SKT) | Survivor pile | 2018-12-31 | 1.0% | −11.4% | −0.9% | 0.25 | 0.16 | survivor |
| Intelsat (INTE) | Filed 2020 | 2019-12-31 | 4.1% | 0.0% | 3.3% | -0.46 | 0.14 | survivor, wrong |
| Six Flags (SIX) | Survivor pile | 2016-12-31 | −1.5% | −49.8% | −1.6% | -0.09 | 0.13 | survivor |
| Tailored Brands (TLRD) | Filed 2020 | 2020-02-29 | 8.5% | −23.5% | −6.4% | -0.04 | 0.12 | survivor, wrong |
| Libbey (LBY) | Filed 2020 | 2019-12-31 | 18.0% | −34.0% | −14.2% | -0.04 | 0.12 | survivor, wrong |
| Briggs & Stratton (BGGS) | Filed 2020 | 2019-06-30 | 11.9% | 64.1% | −2.5% | 0.40 | 0.11 | survivor, wrong |
| Ashford Hospitality (AHT) | Survivor pile | 2018-12-31 | 6.7% | −29.1% | −7.8% | 0.11 | 0.09 | survivor |
| Natuzzi (NTZ) | Survivor pile | 2017-12-31 | 15.5% | 12.7% | −11.8% | 0.45 | 0.09 | survivor |
| Dean Foods (DFOD) | Filed 2019 | 2018-12-31 | 10.0% | −12.3% | −14.9% | 0.17 | -0.11 | bust |
| Cumulus (CMLS) | Filed 2017 | 2016-12-31 | 14.1% | −78.2% | −25.3% | -0.17 | -0.19 | bust |
| Sears (SHLD) | Filed 2018 | 2018-02-03 | −15.2% | −81.2% | −5.9% | -0.34 | -0.25 | bust |
| Ironwood (IRWD) | Survivor pile | 2018-12-31 | 44.2% | −479.2% | −96.4% | -0.37 | -0.36 | bust, wrong |
| NatWest (NWG) * | Survivor pile | 2016-12-31 | −35.9% | −1.6% | −1.1% | 0.06 | -0.74 | bust, wrong |
| Hertz (HTZ) | Filed 2020 | 2020-12-31 | −34.1% | 0.0% | −4.6% | -0.01 | -0.84 | bust |
| Hastings (HAST) | Filed 2016 | 2014-01-31 | −41.4% | 23.6% | −0.6% | 0.45 | -0.84 | bust |
| Banco Macro (BMA) * | Survivor pile | 2015-12-31 | −48.3% | 14.2% | 1.8% | 0.18 | -0.95 | bust, wrong |
| Insys (INSY) | Filed 2019 | 2018-12-31 | 10.1% | −174.6% | −63.7% | -0.18 | -1.15 | bust |
| McClatchy (MNI) | Filed 2020 | 2019-12-31 | −18.1% | −259.6% | −53.1% | -0.44 | -1.18 | bust |
| Akorn (AKRX) | Filed 2020 | 2019-12-31 | −39.2% | −25.9% | −18.2% | 0.22 | -1.23 | bust |
| Peabody (BTU) | Filed 2016 | 2015-12-31 | −54.6% | −4.6% | −20.7% | 0.09 | -1.76 | bust |
| Cobalt (CIEI) | Filed 2017 | 2016-12-31 | 27.5% | 0.0% | −101.4% | -0.27 | -2.63 | bust |
| iHeartMedia (IHRT) | Filed 2018 | 2017-12-31 | −116.5% | −107.1% | −14.7% | -0.48 | -2.69 | bust |
| Windstream (WINM) | Filed 2019 | 2018-12-31 | −172.4% | −120.7% | 11.7% | -0.42 | -3.02 | bust |
| Kona Grill (KONA) | Filed 2019 | 2018-12-31 | −85.7% | −208.7% | −64.2% | -0.28 | -3.16 | bust |
* David's Tea sought creditor protection in 2020 and is still labelled a survivor here. TPVY is a listed note, not common stock. Banco Macro and NatWest are banks. Ratios are the book's figures, shown as percentages of assets except book equity, which is a multiple of liabilities.
The Python for this fit, and the files, are the first machine learning chapter of the yellow book. This page is that argument without the notebook. Please don't mortgage anything because a line said Costco is fine. It is a classroom model on 50 annual reports, two of which aren't quite companies in the sense the ratios assume, and one of which filed while labelled as a survivor.